
November is officially here. It's that time of year when a good book, a warm slice of pie, a hot drink and a slow afternoon with the people you love sound like the perfect weekend. What's not to love!
October was a mixed month across the region, and a lot depended on where you were looking.
Belleville actually picked up. 69 homes sold, up 19% from last October, and the average price rose almost 7%. With about 4 months of inventory, it's now the tightest market in our area.
Quinte West sold a few more homes than a year ago, 47 against 43, and prices held almost exactly where they were. The difference is choice. There are 28% more homes for sale than last October, so buyers can take their time.
Brighton held steady, with 22 sales against 23 last year, and homes there sold at 98% of asking. The average price came in lower, at $578,582, but in a market that size a handful of sales can swing that number quite a bit.
Here in the County, October was the slowest of the four. 34 homes sold, well under the 49 from last October, and homes took 79 days to sell on average, almost double last year's 40. With 252 homes for sale and 7.4 months of inventory, buyers are taking their time.
Zoom out, though, and the year looks steadier. 320 homes have sold in the County so far in 2026, only about 5% fewer than at this point last year.
So where does that leave us? Across all four areas, homes priced for today's market are still selling, at 96% to 98% of asking. The ones priced for last year are the ones sitting.
Around the region: my read, area by area
- The County: 7.4 months of supply and 79 days to sell. Buyers still have time and choice, and homes priced for today are still selling relatively well.
- Quinte West: More choice than a year ago, with 282 homes for sale against 220 last October. Sales were up 9%, so the buyers are there. They just have more to pick from.
- Brighton: Steady. Sales and supply are almost exactly where they were last year, and homes are selling at 98% of asking in 54 days. The average price is down from last October, but with 22 sales a few homes move that number a lot.
- Belleville: The one market that tightened. Sales up 19%, 4.1 months of supply, and homes selling in 38 days.
Under about 4 months of supply generally favours sellers; over 6 favours buyers.
This month's spotlight: Brighton
173 homes have sold in Brighton so far this year, at a median of $635,000 and 98% of asking. That's a steadier year than most of the region has had. What stands out to me is how close to asking Brighton homes are selling, 98% on average in October.
One sale is worth a mention, though. A semi-detached home was listed well below its value to spark a bidding war, and it sold to a cash buyer for 25% over asking, still below what similar homes nearby have sold for. Pricing low in a buyer's market to draw a crowd can backfire. It attracts buyers who can't reach the real number, and it can leave money on the table. In this case, it did.
If you own in Brighton and you're curious where your home fits, just ask and I'll give you a ballpark.
Waterfront snapshot: Prince Edward County
Twenty waterfront homes sold between August and October, down from 33 over the same three months last year. That's 39% fewer sales. Prices held up, though. The median came in at $950,000, about 3% below last year's $980,000, and homes sold for 95% of asking in both years.
The range was wide, from a $270,000 three-season cottage on Consecon Lake to $3.55 million on Lake Ontario. Price decided how long a home waited. Three sold within about two weeks. Seven took 100 days or more, and the longest, on Picton Bay, sold after 395 days for $1,090,000, against a first asking price of $1,499,000.
My read: There are fewer waterfront buyers out there right now, but the ones who are buying are still paying close to asking. Fewer buyers hasn't meant cheaper waterfront. Waterfront that's priced for today's market still sells, and sells fast. Waterfront priced for 2022 waits.
See the full waterfront numbers →
Residential waterfront sales, Prince Edward County, Aug 1 to Oct 31, 2026, compared with the same period in 2025. Source: PropTx MLS®. Medians, not averages. "Of asking" is against the final list price; days are cumulative, including relists.
Vacant land snapshot: Prince Edward County
Seven vacant lots sold between August and October, the same number as last year, at a median of $215,000 against $220,000 a year ago. Land still negotiates harder than homes. The median sale came in at 88% of asking, the same as last year, against 95% for waterfront homes.
Inland building lots sold between $215,000 (14 acres in Sophiasburgh, about five of them protected wetland) and $260,000 (2.7 acres in South Marysburgh with the well, entrance and survey already done). On the water, a Smith's Bay lot with a bunkie sold for $289,500 and a 0.7-acre Picton Bay lot sold for $749,900. A 3.9-acre lot with right-of-way access to the Bay of Quinte sold for $150,000, just 75% of its asking price.
My read: With land, the work already done is what buyers pay for. A drilled well, a survey and a building envelope narrow the gap between asking and selling.
Vacant land sales, Prince Edward County, Aug 1 to Oct 31, 2026, compared with the same period in 2025. Source: PropTx MLS®. Days are cumulative, including relists. Too few sales this period for a meaningful price per acre.
Interest rates: they went up, and it's not all doom and gloom
The main reason is high energy prices. Take gasoline out and inflation is much closer to normal. Here's what that means if you're buying or renewing:
- Variable rates went up 0.25%. Fixed rates barely moved. Variable is still starting almost a full point lower (3.70% vs 4.59% on insured mortgages). With 20% or more down, the gap is narrower: 4.15% vs 4.64%.
- Variable still has the edge if rates hold, but the cushion is thinner. On a $500,000 insured mortgage, if rates don't rise, variable comes out about $20,500 ahead of fixed over five years. If variable rose a full 1% over the next year and stayed there, variable would still come out slightly ahead.
- Renewing in the next 6 to 18 months? Start 4 to 6 months early. Many lenders will hold a rate for up to 120 days.
- Shopping for a home? Get pre-approved now. A rate hold protects you while you look.
- Already pre-approved? Refresh it before you write an offer. Higher rates mean you qualify for a bit less, because lenders test you at 5.25% or your rate plus 2%, whichever is higher.
- Renewing and thinking of switching lenders? If you're not borrowing more, you generally don't have to pass that stress test to move to a new lender at renewal, as long as your file qualifies. There are exceptions, including collateral charge mortgages, so ask before you assume. It can make it easier to shop around.
- On a variable mortgage with a fixed payment? Your payment may not have changed, but more of it is now going to interest. Worth a quick look at your statement.
- Fewer buyers can mean a better deal. County sales were down 31% from last October, so buyers with their financing lined up have more room to negotiate.
Fixed is still the right call for some people, especially if a payment increase would strain your budget. There's no one right answer.
My friend Carlin Poole at Vine Group Mortgage Brokerage put together the full breakdown. If you'd like to talk through your own numbers, she's great to deal with: book a free call with Carlin.
Rates as of November 5, 2026, are "starting from" rates, and vary by lender, property and qualification (OAC). General information, not financial advice. Carlin Poole, Mortgage Agent Level 2, Lic. #M20001328, Vine Group Mortgage Brokerage, Ontario Lic. #13511.
What this means for you
If you're buying
This is a good fall to be shopping in the County. There were 252 homes for sale at the end of October and 34 sold, so you have time to look properly, get your inspections done and negotiate.
Just don't mistake time for a big discount. Homes sold at 96% of asking in October, so sellers who priced well are holding close to their number. The room is on listings that have been sitting well past the 79-day average.
Rates went up on October 28. If you're pre-approved, refresh it before you write an offer. If you're not, now's the time.
Open to looking beyond the County? Quinte West has 282 homes for sale, 28% more than a year ago. Belleville is the opposite, with homes selling in 38 days, so have your financing ready before you book showings there.
If you're selling
The good news is you have less competition than last fall. There are 252 active listings in the County, compared with 317 a year ago.
The harder news is that there are fewer buyers too. Sales were down 31% from last October, and the buyers who are out there are comparing your home against every other listing in its price range.
Price matters more than anything right now. Homes priced right are selling at 96% of asking. The rest sit, and at 79 days on average, that can be a long wait.
Last year County sales dropped from 49 in October to 16 in November. If you're thinking of selling, it's worth deciding now whether to list this fall or get ready for an early spring launch.
If you want to know what your home would realistically bring today, I'm happy to run the numbers for you.
October 2026 by the numbers
Prince Edward County
| Now | Last year | |
|---|---|---|
| New listings | 85 | 124 |
| Home sales | 34 | 49 |
| Avg sale price | $743,524 | $832,428 |
| Active listings | 252 | 317 |
| Months of inventory | 7.4 | 6.5 |
Brighton
| Now | Last year | |
|---|---|---|
| New listings | 55 | 57 |
| Home sales | 22 | 23 |
| Avg sale price | $578,582 | $711,835 |
| Active listings | 115 | 122 |
| Months of inventory | 5.2 | 5.3 |
Quinte West
| Now | Last year | |
|---|---|---|
| New listings | 102 | 100 |
| Home sales | 47 | 43 |
| Avg sale price | $554,953 | $560,844 |
| Active listings | 282 | 220 |
| Months of inventory | 6.0 | 5.1 |
Belleville
| Now | Last year | |
|---|---|---|
| New listings | 151 | 125 |
| Home sales | 69 | 58 |
| Avg sale price | $491,928 | $460,682 |
| Active listings | 285 | 284 |
| Months of inventory | 4.1 | 4.9 |
Average sale price by area, last 13 months
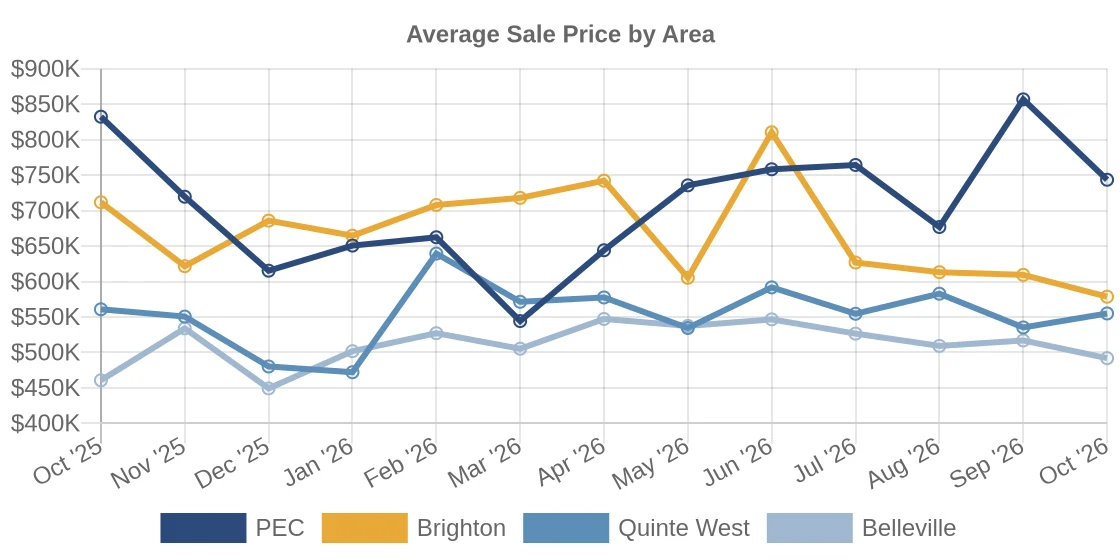
Average sale price by area, rolling 13 months. Source: Central Lakes Association of REALTORS® monthly statistics. Hover or tap the chart to see any month.
Worth a read
Forget 2022. Here's How Your Home Compares to What You Paid.
The headlines measure from the 2022 peak. You didn't buy at the peak. I pulled twenty years of MLS® Home Price Index data for Belleville, Quinte West, Brighton and the County to show what homes have actually done since the year they were bought.
There's a calculator too. Pick your town, enter when you bought and what you paid, and see where you stand today.
P.S. If you or someone you know starts thinking about a move, even if it's just browsing online or asking ChatGPT, I'm always happy to give you the local picture first. A quick text is all it takes: 613-471-0960.
Get it in your inbox
The next issue, the day it comes out
One short email a month. No sales calls. Unsubscribe with one click, any time.